The NORMDIST function in Google Sheets is useful for finding out the value of the normal distribution function given a specific value, mean, and standard deviation.
Table of Contents
Google Sheets is an ideal tool for basic statistical functions. Laying out your data in the spreadsheet, there are various functions you can use to study the data and extract good insights from this survey.
Let’s take an example.
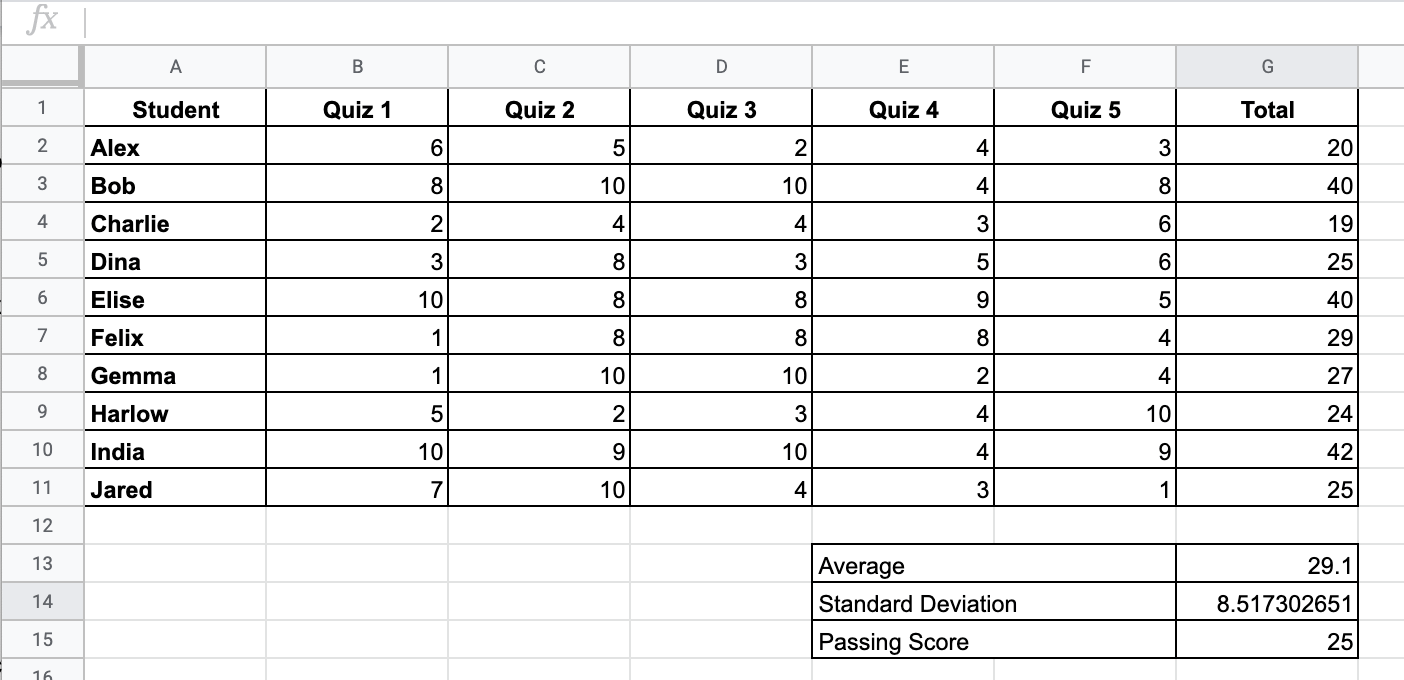
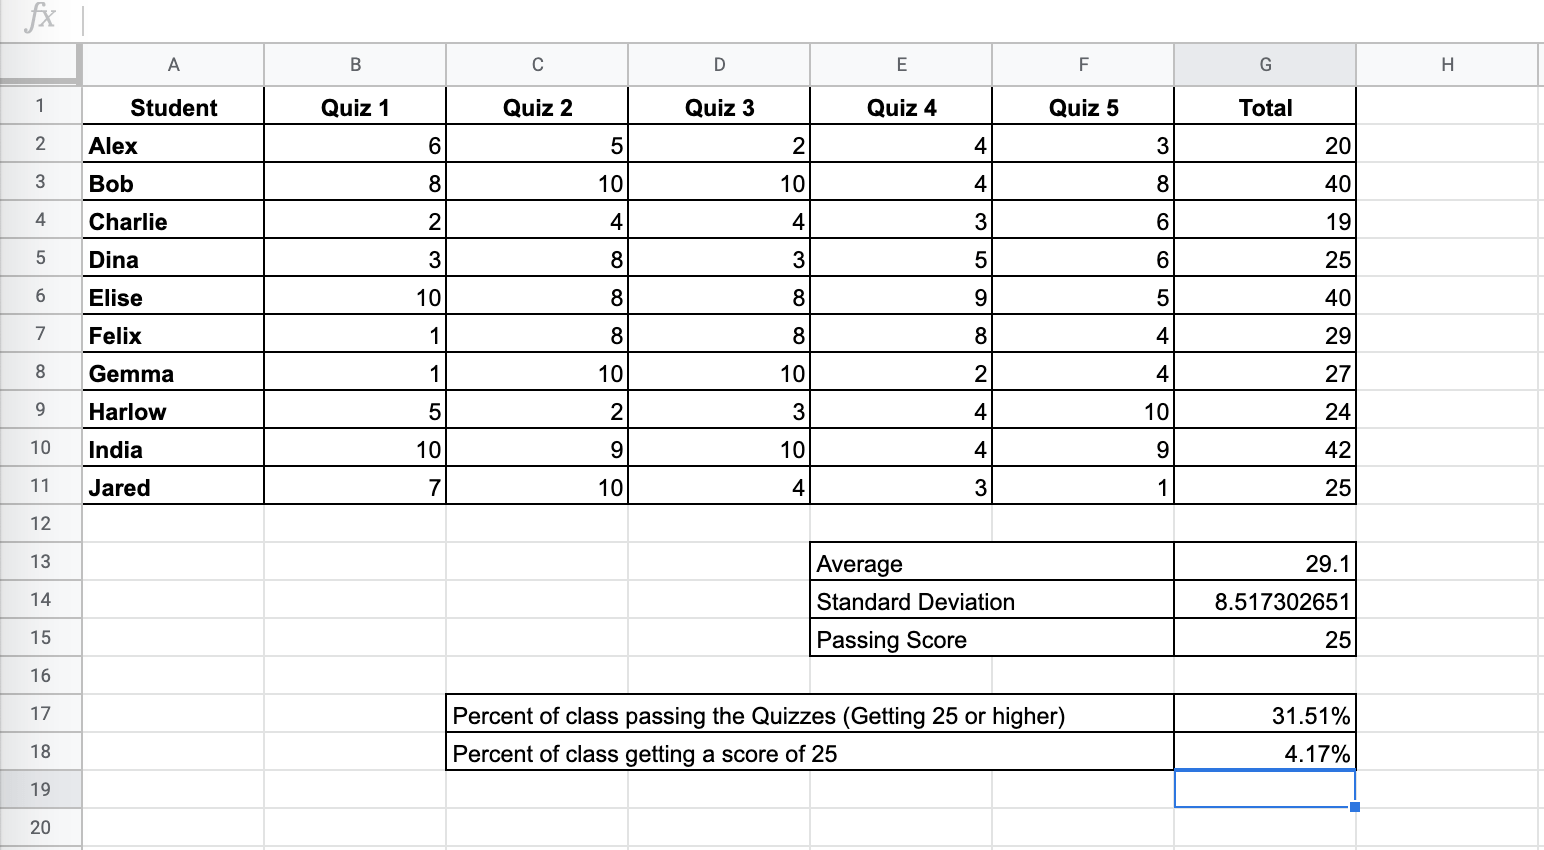
Suppose that you are teaching a course, and you give a total of 5 quizzes throughout the course. Each quiz is 10 points. To pass the quizzes portion, your students must score at least half of the total points. Since there are 5 quizzes with 10 points, there is a total of 50 points. Given your rule, a student must score 25 points to pass.
At the end of the course, you tally the scores and want to get insights about how many people would pass or score high in the quizzes. This will help you adjust and calibrate your lesson plans accordingly. First, you want to see what percentage of people passed based on the normal distribution.
How should we go about this?
Thankfully, the NORMDIST function can help us out with these questions.
We will discuss an example and actual values to help you understand the NORMDIST function in Google Sheets.
The Anatomy of the NORMDIST Function
The syntax (the way we write) the NORMDIST function is simple:
=NORMDIST(x,mean,standard_deviation,cumulative)
Let’s break this down to understand the syntax of the NORMDIST function and each term:
=the equal sign is how we begin any function in Google Sheets.NORMDISTis our function.xis the input to the normal distribution function. Usually, this is the number that you are concerned with.meanis the mean (mu) of the normal distribution function.standard_deviationis the standard deviation (sigma) of the normal distribution function.cumulativeis a true or false input. This is where you specify whether to use the normal cumulative distribution function (TRUE) or the distribution function (FALSE).
NORMDIST is also a helpful function in creating smooth normal distribution curves in Google Sheets.
A Real Example of Using the NORMDIST Function
Let’s look at this example below to see how to use the NORMDIST function in Google Sheets.
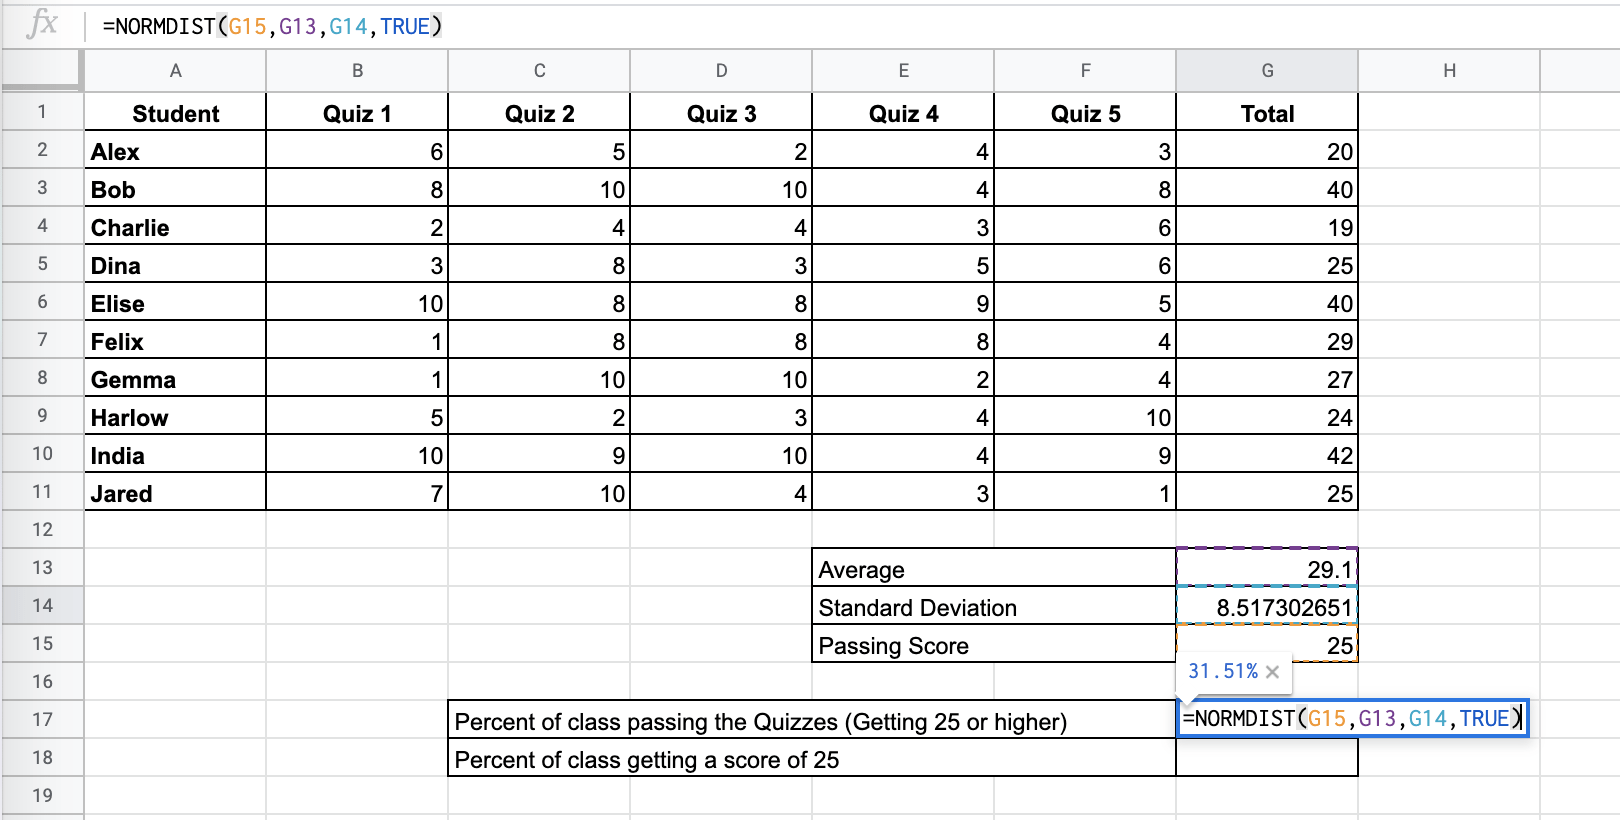
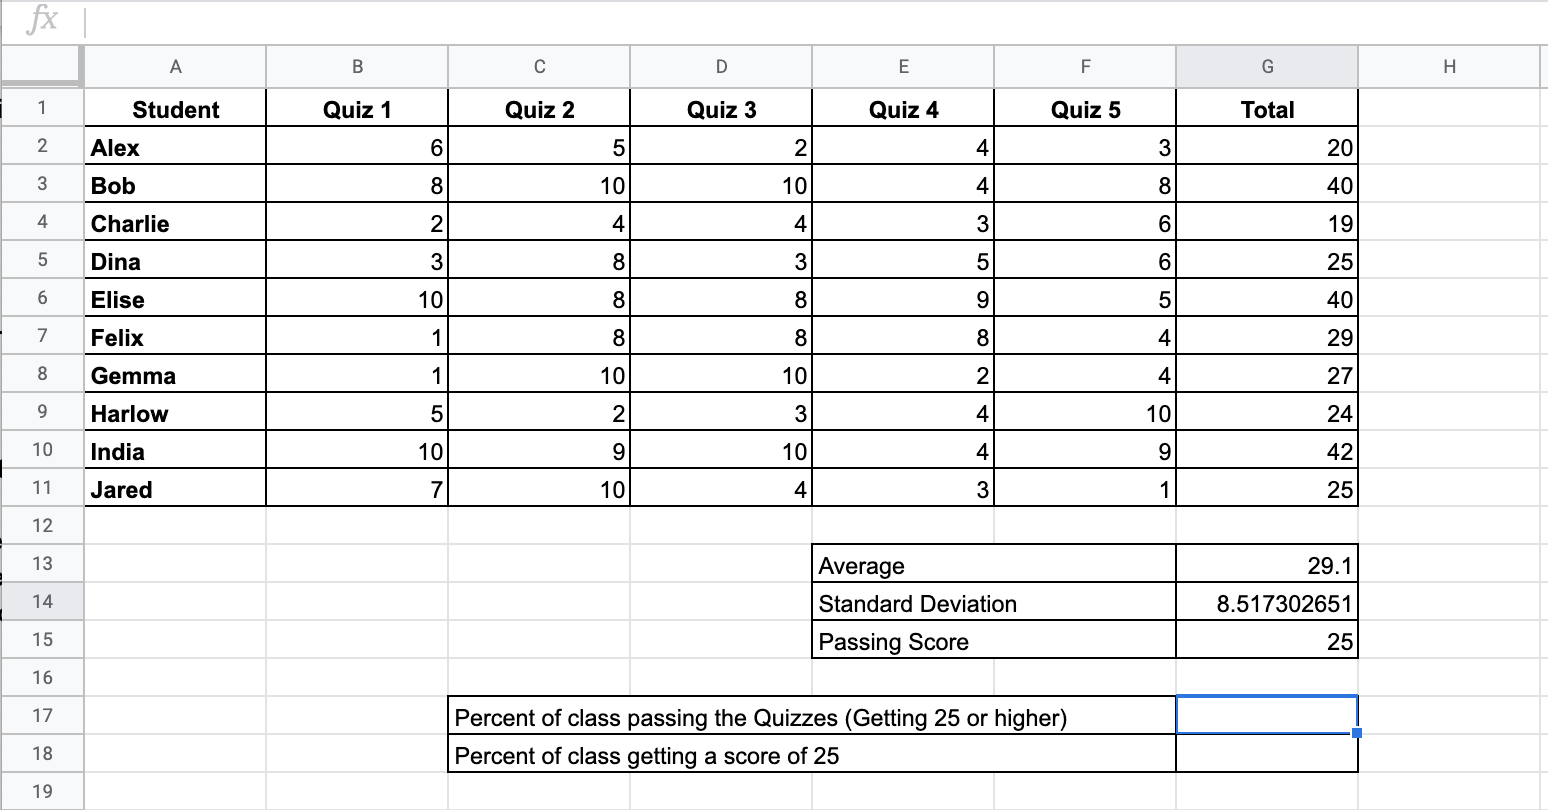
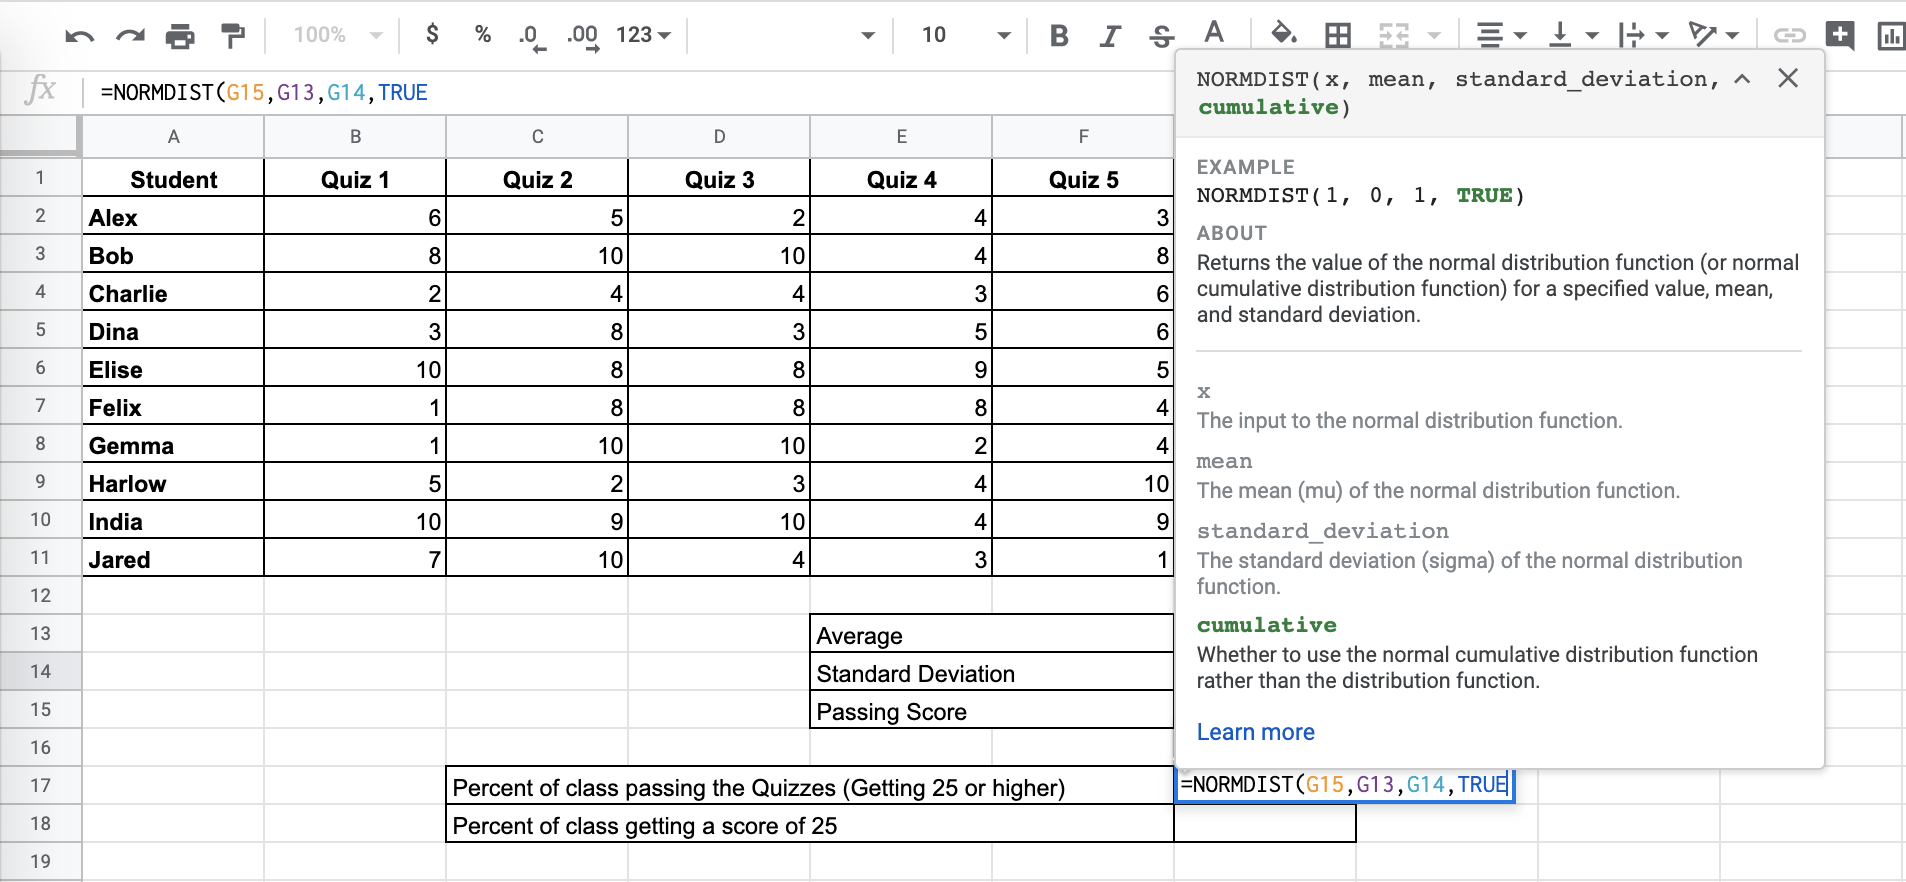
In this simple problem, we want to find out the percentage of students who passed or got 25 points and higher, and the chances of getting exactly 25 points.
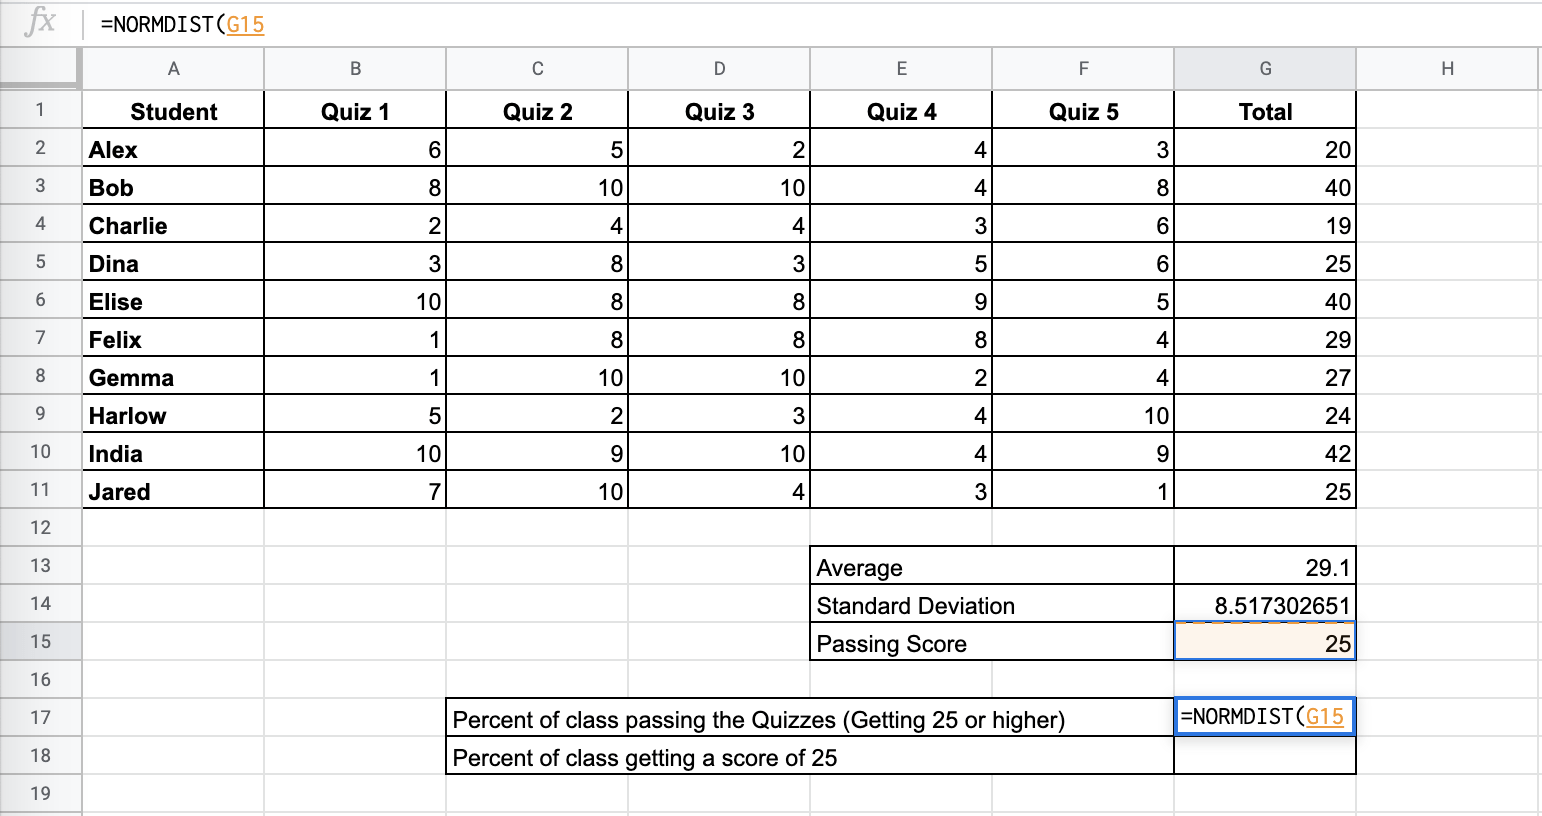
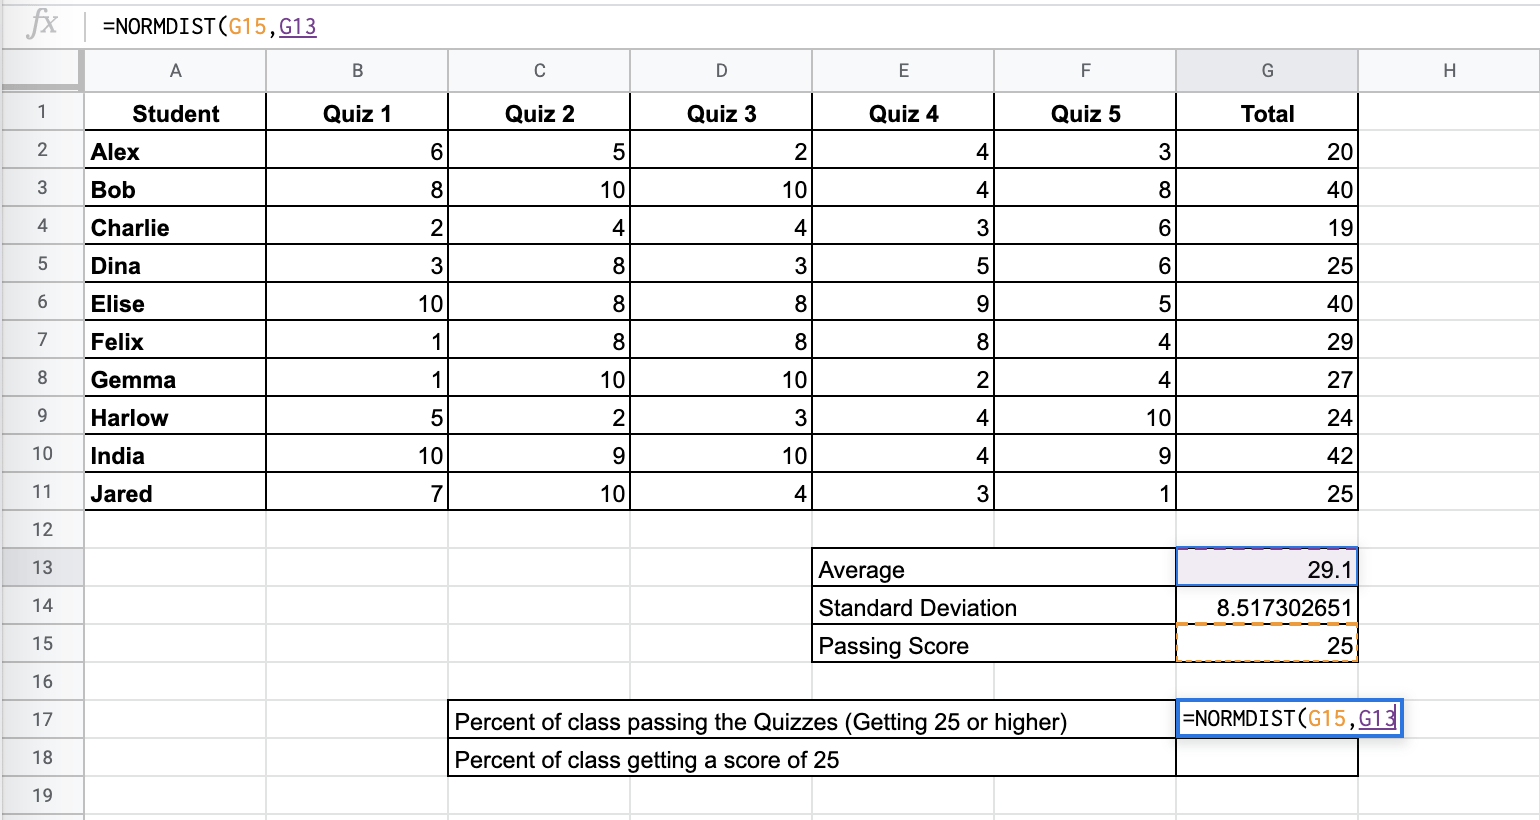
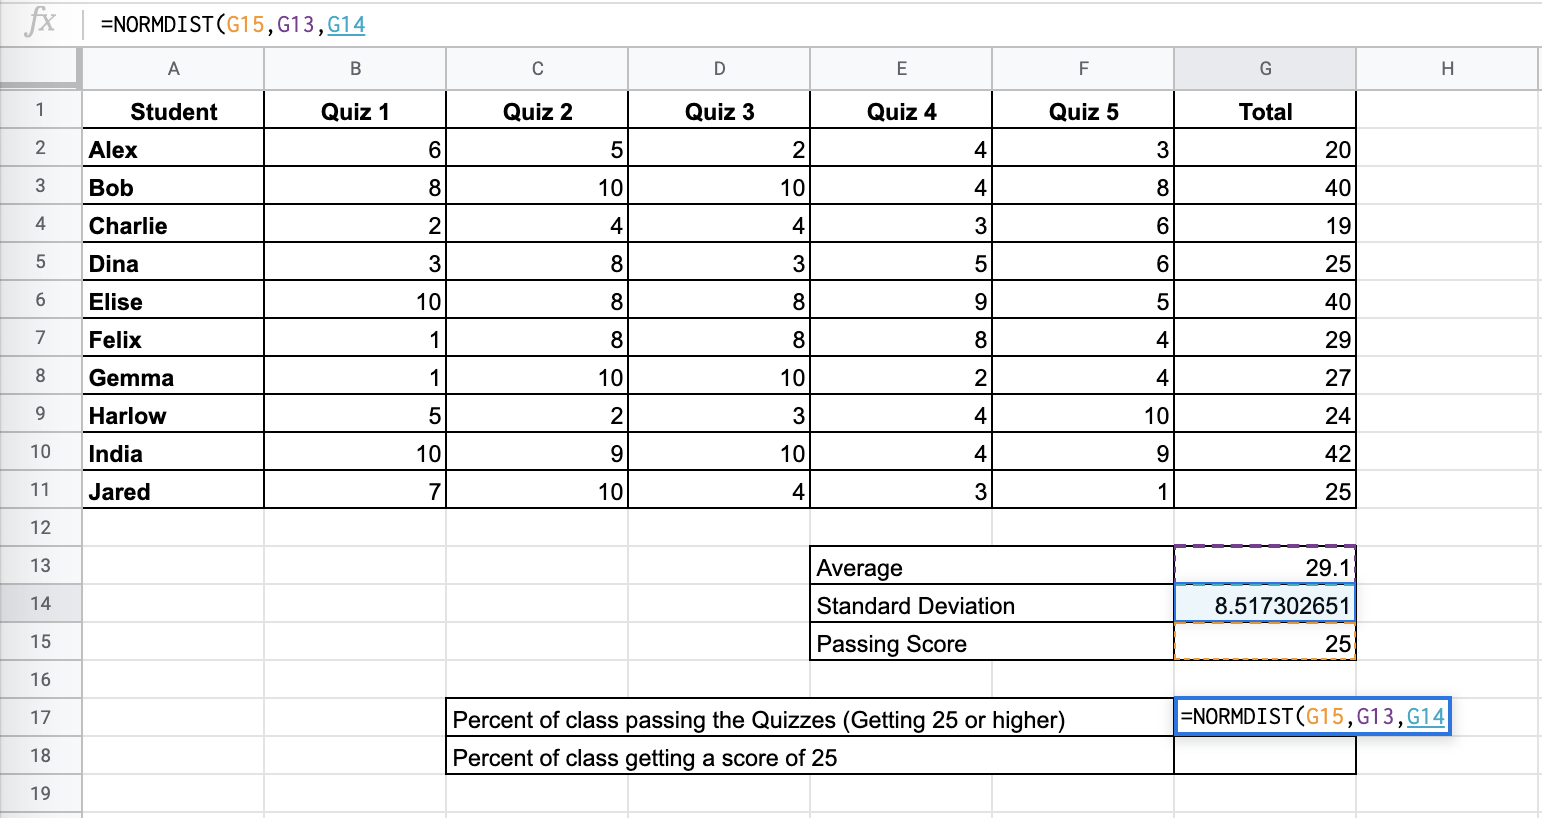
The function with a cell reference is:
=NORMDIST(25,G13,G14,TRUE)
As a result, we get 31.51%.
This simple problem can be practiced. Use the link below to use our spreadsheet sample:
How to Use the NORMDIST function in Google Sheets
In this section, we will show you a step-by-step process on how to use the product function in Google Sheets.
Finding the normal distribution
- To begin, lay out your data accordingly in Google Sheets.

- Determine the average/mean and standard deviation from your data, if not given. You can use the
AVERAGEfunction andSTDEVfunctions, respectively.
- Click on the cell where you want to show your result to make it an active cell.
- Next, type the equal sign ‘=’ to start off the function which is ‘NORMDIST’.
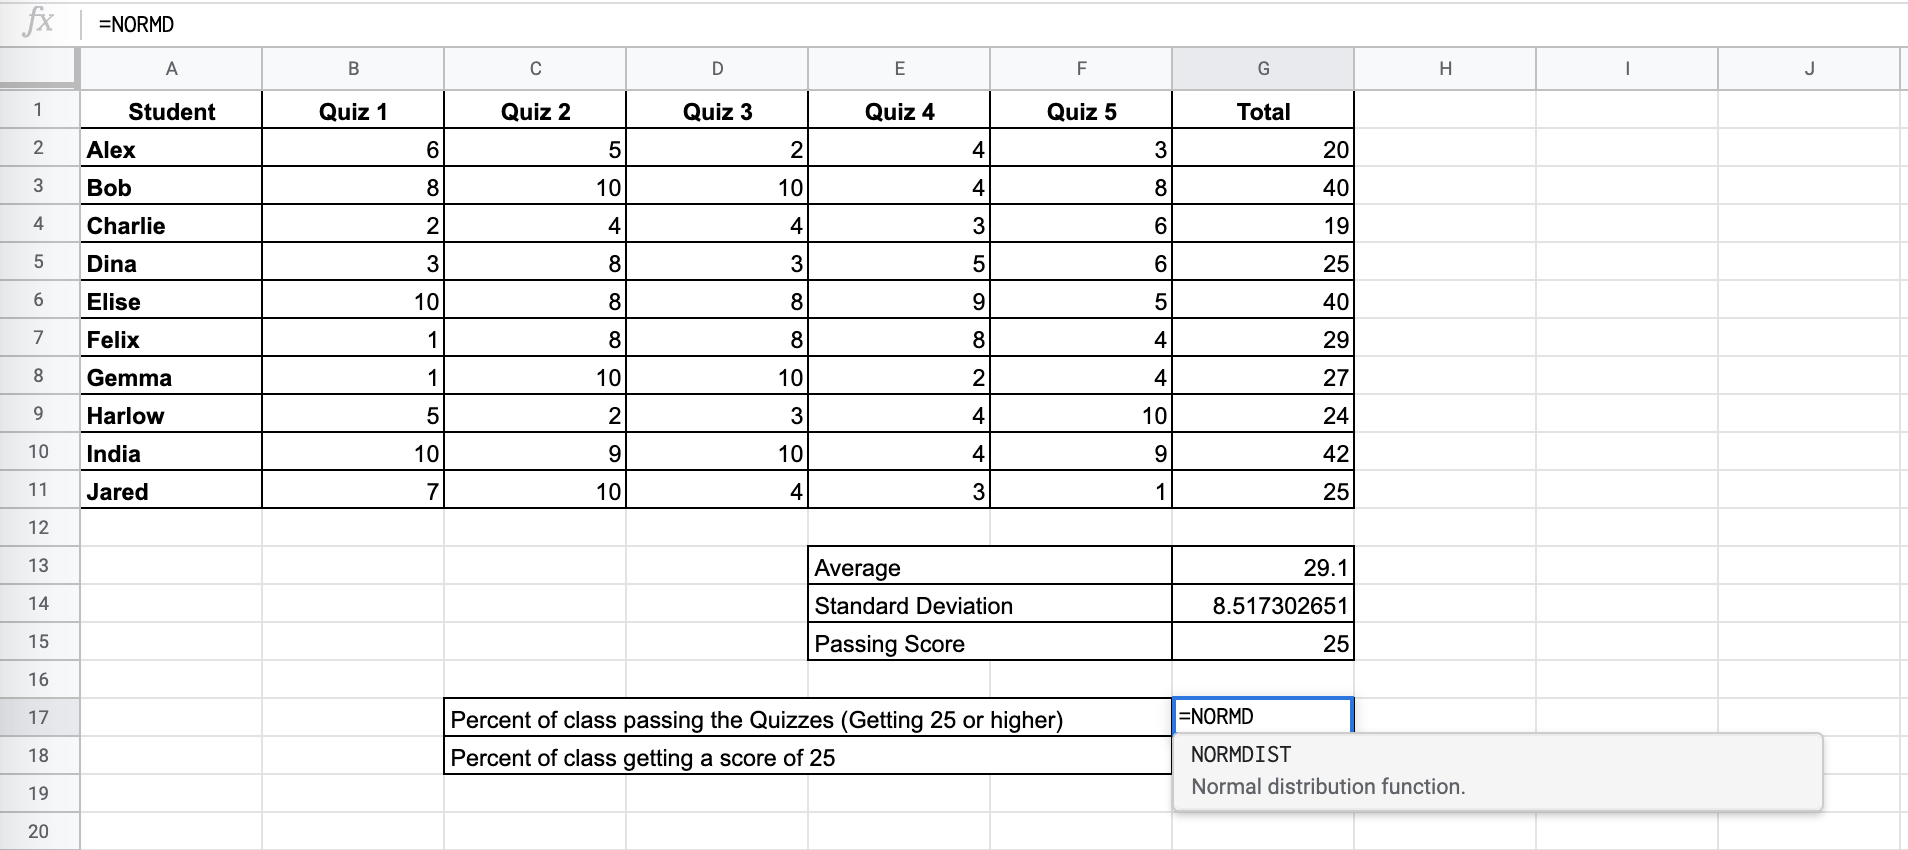
- You can now see the auto-suggest box will pop up with the name of various functions. Make sure that you select the correct one.

- After the opening bracket ‘(‘, you will need to add the x input. In this problem, we’ve determined that you need a score of 25 to pass the quizzes section of the course. You can input this data as a value or a cell reference. We use a cell reference in this problem.
- Next, input the Average or Mean.
- Next, input the Standard Deviation.
- Then, input TRUE or FALSE. Input TRUE if you want the cumulative, or FALSE if you want the percentage that got exactly 25 points.
- Lastly, close the brackets ‘)‘ and hit Enter. Your answer should be displayed in the result cell.
That’s all, good job! You can now use the NORMDIST function together with other numerous Google Sheets formulas to create effective and powerful spreadsheets!