Learning how to obtain prices from the NYSE market in Google Sheets is useful for when you need to create a financial portfolio and monitor it in real-time.
Table of Contents
The New York Stock Exchange (NYSE) is an American stock exchange that is by far the world’s largest stock market by market capitalization of its listed companies. Trading in stocks is a hobby for many, while others invest in stocks as a way to plan for retirement. This is with the expectation that stocks will increase in value over time.
Stock prices, however, are affected by a number of factors. They may change every hour or minute, with high volume stocks changing as frequently as every second. These changes usually fluctuate up and down, with low predictability. As such, a tool to monitor stock prices is needed to gauge performance.
Google offers Google Finance as a way to view stock data, which includes charts that allow you to see company performance over time. However, did you know that there is a dedicated function in Google Sheets that allows you to import data from Google Finance? Being able to insert data into a spreadsheet allows you to manipulate it in the way that you need. This also means you could view data from multiple companies simultaneously, all in one place.
This function is called the GOOGLEFINANCE function. It is a powerful function that allows you to get live and historical data, mutual fund data, and currency exchange rates. In this tutorial, we shall focus on how to use the GOOGLEFINANCE function to extract real-time NYSE data.
Now, let us get to know more about the GOOGLEFINANCE function!
The Anatomy of the GOOGLEFINANCE Function
So the syntax (the way we write) of the GOOGLEFINANCE function is as follows:
=GOOGLEFINANCE(ticker, [attribute], [start_date], [end_date|num_days], [intervals])
Let’s dissect this thing and understand what each of these terms means:
=the equal sign is just how we start any function in Google Sheets.GOOGLEFINANCE()this is ourGOOGLEFINANCEfunction. It fetches current or historical securities information from Google Finance.tickerrepresents the ticker symbol for the security to consider. To achieve accurate results and prevent discrepancies, both the exchange symbol and ticker symbol must be used. If the exchange symbol is not specified,GOOGLEFINANCEwill use its best judgment to choose for you.attributespecifies the type of data to fetch abouttickerfrom Google Finance. The square brackets ‘[]’ indicate that this is an optional parameter, but is required if a date is specified. By default, the function returns the “price” parameter. AvailableGOOGLEFINANCEattributes are different for real-time, historical, and mutual fund data.start_dateindicates the start date when fetching historical data. The square brackets ‘[]’ indicate that this is an optional parameter. Whenstart_dateis specified andend_date|num_daysis not, only the single day’s data is returned.end_date|num_daysindicates the end date when fetching historical data. The square brackets ‘[]’ indicate that this is an optional parameter. Alternatively, the number of days from thestart_datemay be used.intervalspecifies the frequency of returned data. The square brackets ‘[]’ indicate that this is an optional parameter. Values may be “daily” or “weekly”, alternatively, 1 or 7.
Some Notes About the GOOGLEFINANCE Function
To use the GOOGLEFINANCE function properly, some things should be noted:
- All parameters must be enclosed in quotation marks or be references to cells containing text. Note: An exception is when parameters are specified as a number (
intervalof 1 or 7,end_date|num_daysas the number of days). - Some attributes may not yield results for all symbols.
- Quotes are not sourced from all markets and may be delayed up to 20 minutes.
As we will only be learning about extracting real-time data, details regarding historical and mutual fund data are not discussed. For more information about the GOOGLEFINANCE function, check the official GOOGLEFINANCE function guide from Google Docs Editor Help.
What is a Ticker Symbol
Looking at the syntax of the GOOGLEFINANCE function, only the ticker and attribute parameters are relevant to extract real-life data, with the ticker parameter being the most important part of the function. But what exactly are ticker symbols?
A ticker symbol or stock symbol is an abbreviated name used to uniquely identify traded securities such as stocks, shares, currency, etc. It may consist of letters, numbers, or a number of both. As stated above, both the exchange symbol and ticker symbol must be used to achieve accurate results.
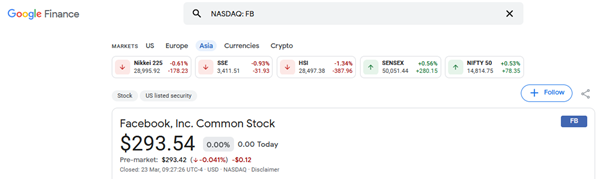
There are multiple ways to obtain the ticker symbol. One way is through a simple google search. Simply type out the company name supplemented by “stock price”. For example, looking up “facebook stock price” on google gives the following result:

As you can see, the google search method already gives both the exchange symbol and ticker symbol (NASDAQ:FB).
Other ways include using tools like Yahoo Finance lookup and Google Finance. Looking up “facebook” on Yahoo Finance, only the ticker symbol will appear beside the company name.

Similar to the google search, both the exchange symbol and the ticker symbol will show up on the Google Finance tool. These will show up at the search bar. The ticker symbol is also emphasized in a blue box.
Although results from google search are extracted from Google Finance, using the tool provides a faster way of obtaining the needed symbols. Even when just typing out the company name, a list is shown of possible companies and at different markets. Just note that the symbols below the company name from the search list are arranged ticker symbol first followed by the exchange symbol. As such, they have to be reversed when inputted into the GOOGLEFINANCE function.

Using the Google Finance tool also acts as a way of determining if the GOOGLEFINANCE function can return data. Since quotes are not sourced from all markets, if a given company is listed down on Google Finance, you can be assured that a value will return. This is because the GOOGLEFINANCE function fetches data from this site.
Since we are interested in obtaining data from NYSE, specifically, another useful tool for obtaining symbols for NYSE is eoddata. Opening the link shows you a list of symbols for NYSE, which are arranged and grouped alphabetically.

Take note that the symbols displayed are only the ticker symbol. It is important to input these symbols with the exchange symbol “NYSE”. The function will still work if only the ticker symbol is used; however, there may be instances where the same ticker symbol is used for different exchanges.
Looking at the search result from Google Finance earlier, Facebook is present in various exchanges. While not all exchanges use the same ticker symbol, the NASDAQ Stock Market and Mexican Stock Exchange (BMV) do. GOOGLEFINANCE will use its best judgment to select where to obtain data from if the exchange symbol is not specified. This will not be an issue if you want to obtain from NASDAQ, but what if you need stock prices from BMV? Specifying the appropriate exchange symbol will eliminate this issue.
Now that we know what a ticker symbol is, and how to obtain it, let’s check out what kinds of real-time data we could obtain using the GOOGLEFINANCE function.
GOOGLEFINANCE Function Real-Time Data Attributes
The list below shows the available attributes that you could use for real-time data using the GOOGLEFINANCE function.
- price – Real-time price quote, delayed by up to 20 minutes.
- priceopen – The price as of market open.
- high – The current day’s high price.
- low – The current day’s low price.
- volume – The current day’s trading volume.
- marketcap – The market capitalization of the stock.
- tradetime – The time of the last trade.
- datadelay – How far delayed the real-time data is.
- volumeavg – The average daily trading volume.
- pe – The price/earnings ratio.
- eps – The earnings per share.
- high52 – The 52-week high price.
- low52 – The 52-week low price.
- change – The price change since the previous trading day’s close.
- beta – The beta value.
- changepct – The percentage change in price since the previous trading day’s close.
- closeyest – The previous day’s closing price.
- shares – The number of outstanding shares.
- currency – The currency in which the security is priced. Currencies don’t have trading windows, so open, low, high, and volume won’t return for this argument.
Another useful attribute is “name”, which pulls the listed company name in Google Finance for the given ticker. This could act as a means for you to check if the GOOGLEFINANCE function has selected the company you want.
A Real Example of Using the GOOGLEFINANCE Function
Let’s look at an example to see how the data looks like from both Google Sheets using the GOOGLEFINANCE function and the Google Finance website. For this example, we shall be looking at Ford Motor Company. The picture below shows all the data obtained using the GOOGLEFINANCE function.

As you can see, the GOOGLEFINANCE function will work even if the ticker or attribute is typed in or cell references are used. For the ticker parameter, not specifying the exchange symbol for the ticker symbol “F” yielded the same results as this ticker symbol is not used in other exchanges. However, always include the exchange symbol to accurately obtain the results you need.
Looking at the Google Finance website, you will first be greeted with a large chart showing how stock prices fluctuate over a period of time. Time intervals of 1 day, 5 days, 1 month, 6 months, year to date, 1 year, 5 years, or the whole lifespan of the company can be selected.
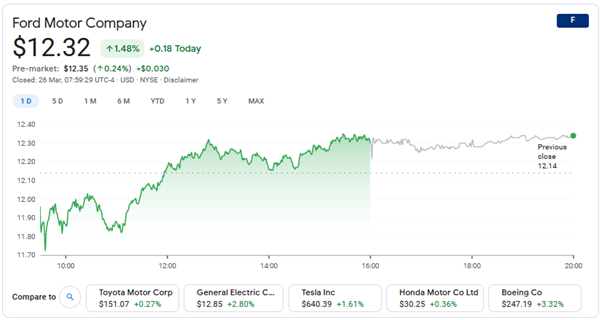
This section shows the company name, current price, price change, and percentage change for the day. Scrolling down also shows a Key stats section where most of the data the GOOGLEFINANCE function pulls. These include: high, low, marketcap, volumeavg, high52, low52, and closeyest.

Lastly, a financial performance chart may be located, where quarterly or annual data may be seen. From the annual chart, the earnings per share (eps) value that GOOGLEFINANCE pulls may be located.

Now that we have learned all about the GOOGLEFINANCE function, let’s now move to a real-life scenario where real-time data from NYSE is obtained.
How to Get NYSE Real-Time Prices Using GOOGLEFINANCE Function
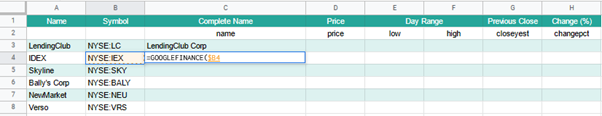
For the following scenario, the companies whose real-time stock data I want to pull are LendingClub, IDEX, Skyline, Bally’s Corp, NewMarket, and Verso.
- Using Google Finance, search for the ticker symbols of the companies whose stock data you want to pull. Input these values with the exchange symbol “NYSE” and a colon “:” before it.

- Create new columns corresponding to the kinds of data you wish to pull. For this example, I wish to obtain the complete name of the company (for verification), the stock’s current price, day range, previous close value, and percent change from this value.

- Insert a new row directly below the header row. In this row, type in the corresponding
attributeparameter for the data you wish to pull.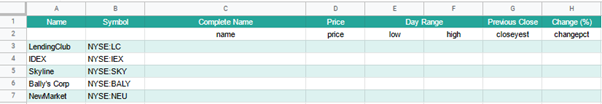
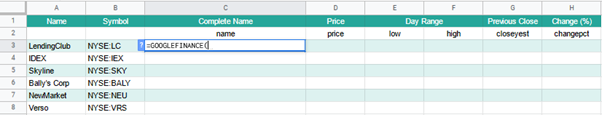
- Simply click on any cell to make it the active cell. For this guide, I will be selecting C3, where I want to show my result.

- Next, simply type the equal sign ‘=’ to begin the function and then followed by the name of the function, which is our ‘googlefinance’ (or ’GOOGLEFINANCE’, whichever works). You should find that as you are typing, an auto-suggest box appears with the names of the functions that contain the text that you have typed.

- The one we want is the GOOGLEFINANCE function, so make sure to click on the GOOGLEFINANCE function. Alternatively, you may select the function by pressing the arrow down keys then pressing Enter or Tab to use the function (the currently selected function will be highlighted in grey and have a brief description below).
- Upon selecting a function, a large text box appears that gives details about the function, and how to use the function. In some instances, a blue question mark will appear on the left side of the cell. If you want this text box to appear, simply click this question mark to show the large text box. Clicking on the arrow at the top right-hand corner will minimize the box while clicking on the x mark close the text box and the blue question mark will appear.

- Now, let’s select the
tickerparameter. For this cell, we want to pull data from LendingClub. Type the “NYSE:LC” symbol enclosed with quotation marks. Note how values enclosed in quotation marks will be colored green.
- Now, let’s select the
attributeparameter. For this cell, we want to obtain the complete name of the company. First, type a comma “,” to indicate that we have finished inputting thetickerparameter and would like to input theattributeparameter. Next, type out “name” enclosed with quotation marks. See how even before finishing the formula, a text box pops up showing the value theGOOGLEFINANCEfunction has obtained.
- Press the Enter key to finish the formula. This process may be repeated for the rest of the values, but doing so would be time-consuming and inefficient. Therefore, let’s use relative cell references to make this task easier!
- After pressing the Enter key, we are now in cell C4. Repeat steps 5 and 6 to select the
GOOGLEFINANCEfunction. This time, instead of typing out thetickerparameter for IDEX, let’s use cell references. Select Cell B4. This will highlight the selected cell while also inputting “B4” in the formula.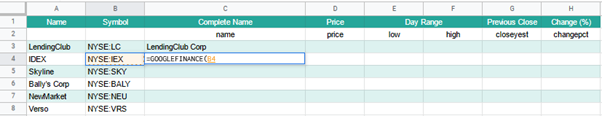
- To convert this cell reference to a relative cell reference, press the F4 key three times. Doing so will change the “B4” value in the formula to “$B4”. This means that when the formula is copied, the function will always pull data from the B column, even when this formula is copied to other columns. Alternatively, you can also simply type a dollar sign “$” before the column you want to keep.
- Now, let’s select the
attributeparameter. Type a comma “,” then select cell C2. We also need to convert this cell reference to a relative cell reference where the row is kept constant instead of the column. Therefore, the dollar symbol must be before the number corresponding to the row. Press the F4 key two times.
- Press the Enter key to finish the formula. Finally, simply copy the formula from cell C4 to the remaining cells to fill the table. Looking at cell E5, we can see that the correct values have been obtained through the use of relative cell references.

We’re done! Expect some differences between the results that you obtain from the ones obtained in this tutorial. As stated earlier, this is due to stocks fluctuating in value. If you want to practice some more, make a copy of our spreadsheet and give it a try:
Or browse our other numerous Google Sheets formulas to create even more powerful formulas that can make your life much easier.