The STDEVP function in Google Sheets is useful to calculate the standard deviation across an entire population. It is used as metrics that show how far apart are different values in a data set from the average.
Table of Contents
The STDEVP function is a statistical function that describes the dispersion or variation around the data set’s mean value. We use it to figure out how far apart are the different numbers in our data set from the average.
The smaller the value we get for STDEVP represents that the closer the numbers are in the entire population.
Let’s look at an example.
Say you are making home-made chocolate bars 🍫. Since you are making them manually, the length of each bar is not always exactly the same, but it varies around an average length.
We would like to know how widely values vary around the average.
Our example chocolates’ sizes are 23, 27, 17, 22, 24, 24, 29 and 21. The number of values is 8 (COUNT) and the average of these values is 23.375 (AVERAGE).

The STDEVP function is built-in in Google Sheets, so you don’t need to fully understand how exactly it is calculated in order to use it. However, let’s have a quick look at the method:
- Calculate the simple average of the numbers
- Subtract each number from the average and square the results
- Calculate the average of those squared differences (this is called the variance)
- Take the square root of that number to get the population standard deviation
To sum up, the result is the average of the squared differences from the mean.
The Anatomy of the STDEVP Function.
Now let’s use the built-in STDEVP function to get the population standard deviation of our chocolate values with one simple formula.
The syntax of the function specifies how should we work with it:
=STDEVP(value1, [value2, …])
Let’s dissect this thing and understand what each of these terms means:
=the equal sign is just how we start any function in Google Sheets.STDEVPthis is our function. We will have to add the corresponding value(s) into it for it to work.value1is the first value or reference to the range of the dataset.value2,value3, … – [ OPTIONAL ] – are the additionalvaluesor references to ranges that contain values we need to include in the dataset.
As you can see, it is possible to use the function with one value or multiple values. As mentioned above, having at least one value is mandatory in order to get this function to work and any additional values are optional.
Now you may think: “How can I use only one value to calculate the standard deviation?”
Don’t get confused with what one value means here. Let’s look at the syntax again: value1 is the first value or reference to the range of the dataset. In other words, the value of this function can be either:
- a number
- or a range of numbers defined by a formula.
⚠️ Notes to Make Your STDEVP Function Work Perfectly
- You have to add at least one
value(as a number or a range), but you can add up to 255valuesin oneSTDEVPfunction. STDEVPignores string parameter values (or cells that include text values). If all your parameter values are strings, you are going to get an error.- Similarly, it ignores blank cells, boolean values or error values if they are included in the range reference.
- If you use text, blank cells, error values or boolean values directly in the formula (not in a range),
STDEVPwill return #VALUE! error. To calculate standard deviation while interpreting these values as 0, you can use another function calledSTDEVPA. - There is another similar function called
STDEV(standard deviation) that is for sample, not for an entire population. We will cover this in a future post so make sure to subscribe to be notified. 🙂 - Since the standard deviation is calculated as the square root of the variance,
STDEVPis equivalent toSQRT(VARP(...))when using the same dataset. So you can use the latter as an alternative although syntactically it looks less simplistic.
A Real Example of Using STDEVP Function
Take a look at our chocolate bar example to see how STDEVP functions are used in Google Sheets.
We can get the population standard deviation of these values with the following expression:
=STDEVP(B2:B9)
B2:B9 is value1 here, representing one range of numbers. We only used the one mandatory value1.

Upon hitting the Enter key, we get a single number that represents the standard deviation of the population: 3.43.
The meaning of this number is, that most of our chocolate bar’s length is in +/- 3.43 range from the mean.
In this example, we only used one mandatory value in the function, the simplest version. How can it be useful to have multiple values as arguments?
Depending on the structure of your spreadsheet, you might not always be able to define all your desired values as one range of numbers. It is possible that need to add more than one expressions to collect all the values of the population.
For example, you would like to calculate the standard deviation of the above-mentioned chocolate bars and 2 other values (say 24 and 25) that are not in the sheet for some reason.
So how do you use the STDEVP function without changing the data set? You just have to add two more arguments to the STDEVP function and it will calculate the standard deviation of the now 10 numbers (the previous range of 8 numbers and 2 additional).
Look at the below example in how this is done:
=STDEVP(B2:B9, 24, 25)
Now have a look at our example sheet to see that it is perfectly working:
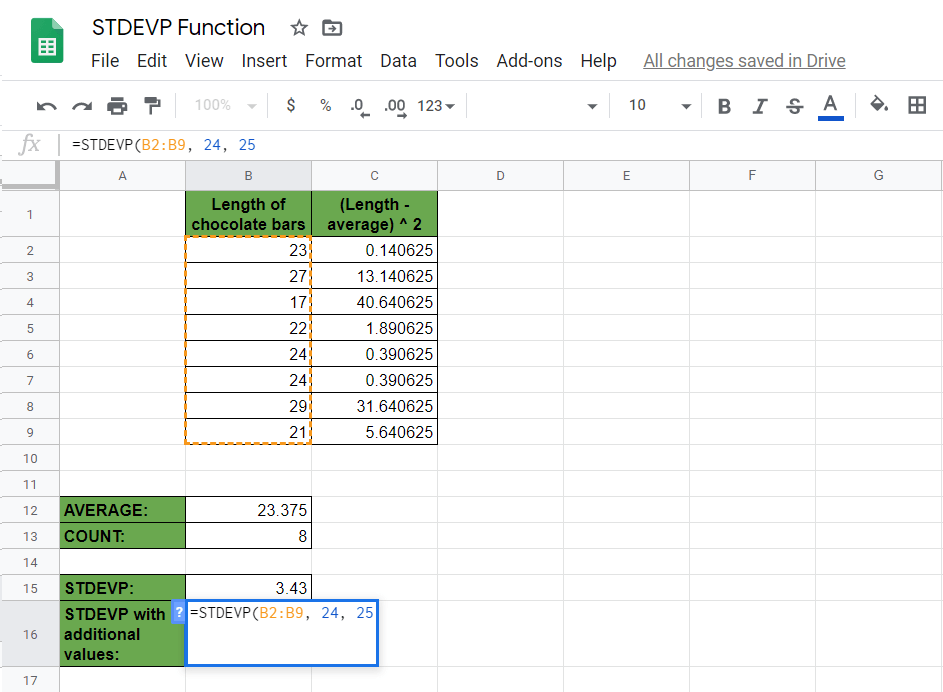
And we get a new standard deviation value for our extended population which is 3.10 now.
Perfect! There are infinite options to apply the STDEVP function on different data sets.
You may make a copy of the spreadsheet using the link I have attached below and try it for yourself:
How to Use STDEVP Function in Google Sheets
We are going to use another example, where we want to calculate the standard deviation of a data set containing different income values for each month of a year.
- Simply click on any cell to make it the active cell. For this guide, I will be selecting B15 where I want to show my result.
- Next, type the equal sign ‘=‘ to begin the function and then followed by the name of the function which is ‘STDEVP‘.
- Now what you need to do is select the range of cells that you want to use the STDEVP function on. I will be highlighting cells B2 to B13 to include them as the function’s range argument.

- Hit Enter and you will see the population standard deviation of your values. (You might want to limit the number of decimals in Format > Number > Number)

- Now let’s try with more arguments. Say we want to use the STDEVP function only with the values of certain months: January, February, March, July, September, November, December. Start typing the function ‘=STDEVP(‘ and then add only the fields we need. You can add January, February and March as a range ‘B2:B4‘, but we are not done here as we want to add more values. So after our first range, type a comma ‘,‘.
- Now type or select the next field we would like to add to our calculation. It is ‘B8‘ for the value of July. Good, next comes September, let’s add it too by typing or selecting ‘B10‘. Finally, we can add November and December as a range which is ‘B12:B13‘.
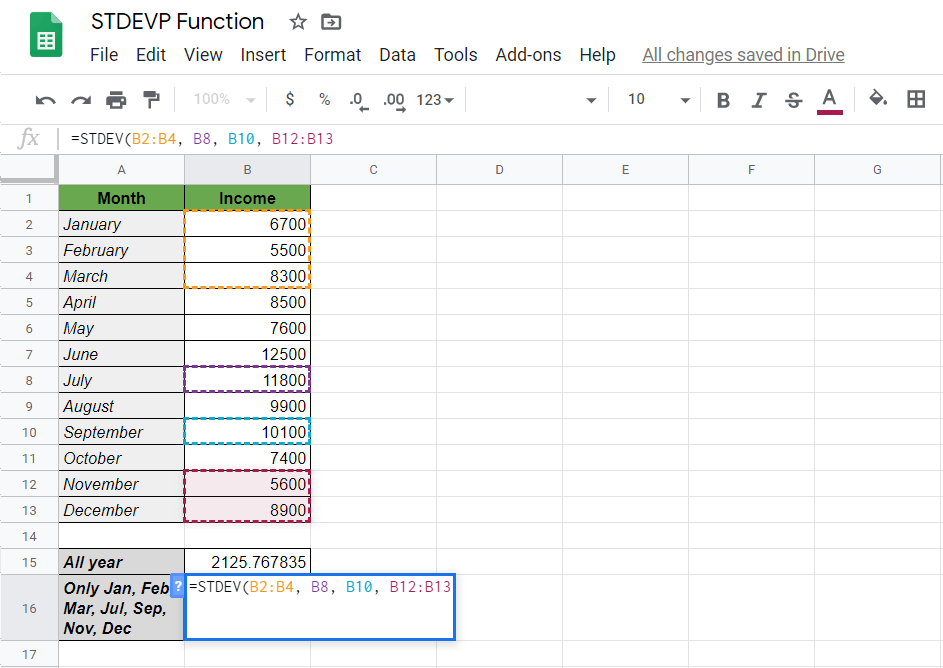
- Finally, just close the function with the closing bracket ‘)‘ and hit Enter. You will see the result for only these selected months. Don’t forget: you can add up to 255 values!

That’s pretty much it. You can now use the STDEVP function together with the other numerous Google Sheets formulas to create even more powerful formulas that can make your life much easier. 🙂